
 How to resolve AdBlock issue?
 How a Simple Tool Changed the Way We Analyze Email Test Results

Want to make the right choice? Run a test. A series of tests will be even better (for validation).
Some of the large companies we work with require testing several hypotheses in a single email campaign. To make the necessary changes fast, we needed a convenient way to work with the data we gathered. That’s why we’ve developed a Tester’s Book: a place to store and analyze test results.
How we created a Tester’s Book
One of the clients asked us to make a slide deck with all the tests we ran for them over the last two years. They wanted to share it with the company management and other departments and brands within the corporation.
We developed a slide deck that was so convenient, helpful, and informative that we decided to start using it on a regular basis. Now it’s our main testing framework for the project.
What is a Tester’s Book and how to make one?
A Tester’s Book is a document with the data on all the tests we ran and the results we achieved. We make it using Google Slides where every slide is a separate test.
Test structure
To make the slide deck easy to navigate, we developed a standard test structure:
- Heading that described what we tested and what results we got;
- Test date;
- Segment that was tested: results may vary depending on the segment;
- Confidence level;
- Options tested;
- Results for every option we tested;
- Conclusion;
- Link to an email (optional).
Example of a slide from the Tester’s Book
You can also add visuals to your slides: for example, banners or buttons you want to test.
How to use the Tester’s Book
We place the slides with the test results in chronological order: this way, it’s easier to analyze the data and draw the right conclusions.
For example, we decided to test which product grids would perform better among the members of the customer’s loyalty program at levels 2-4: a static product grid with the bestsellers vs. a dynamic product grid.
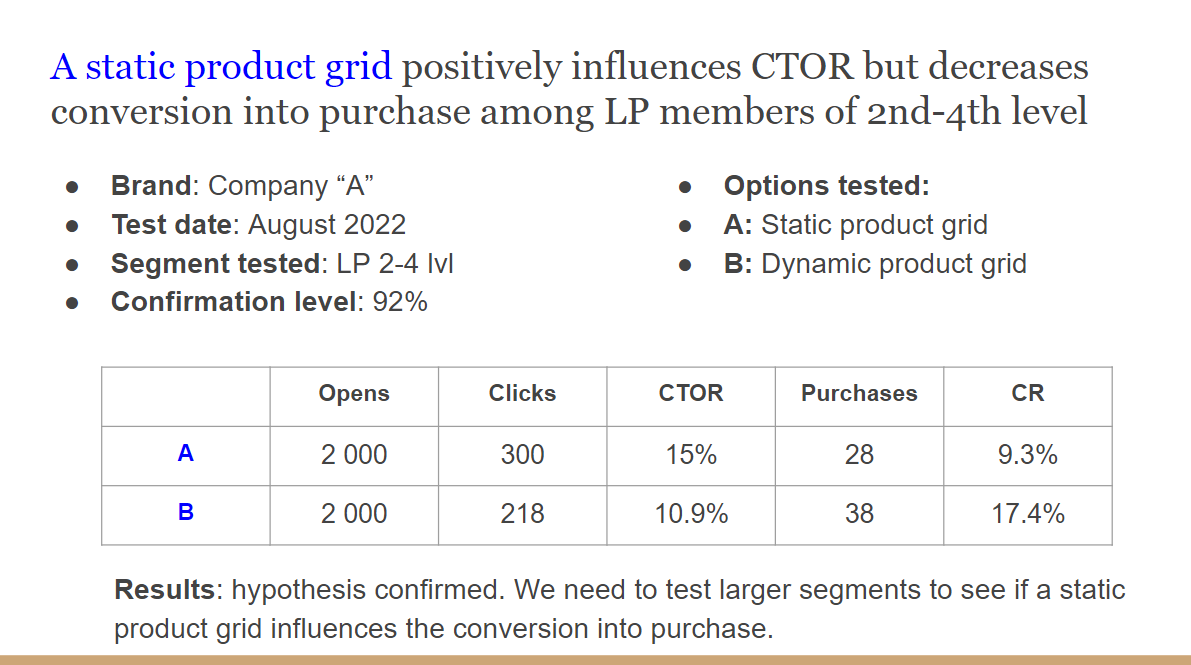
The bestsellers show better clicks but worse conversions. We know that users of the 2nd-4th levels of the loyalty program made purchases before. We have more data on them, and they’re more loyal and engaged. As a result, the set of goods they receive is more personalized. That’s why dynamic product grids may work better only for this segment of customers.
Let’s run the same test on the segment of customers who are at the 1st level of the LP and haven’t made a purchase yet.
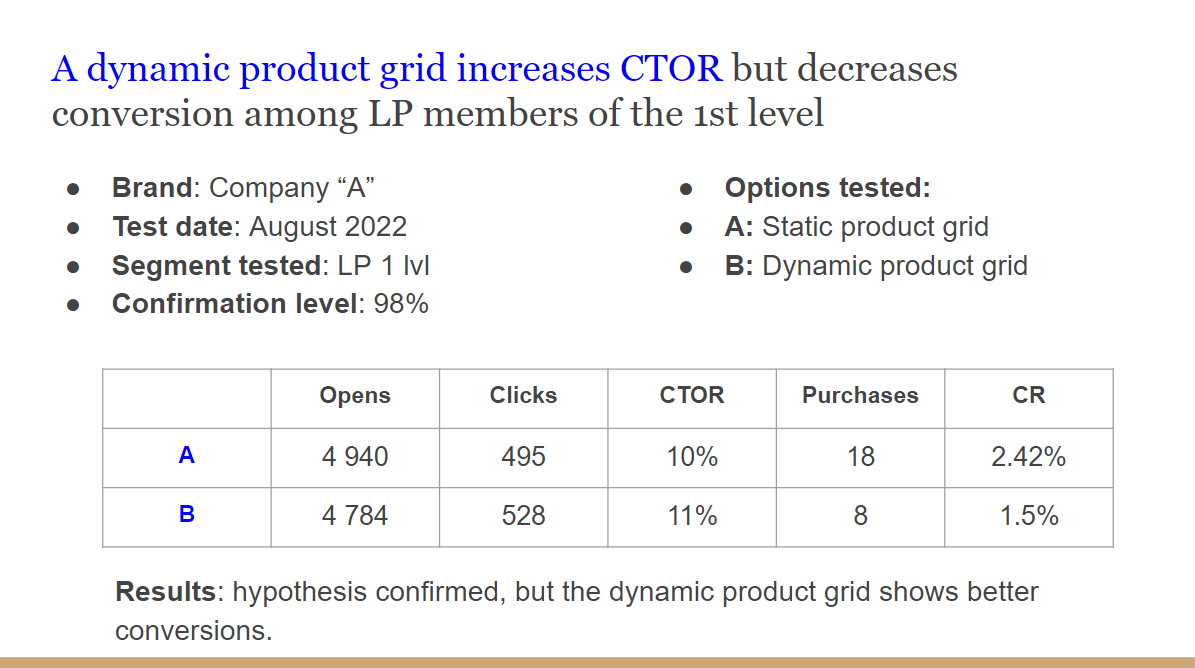
Well, that’s what we expected.
While analyzing the results, we come up with new hypotheses:
- Let’s run tests on users who’ve just signed up.
- What if we change the set of goods in the static product grid? Will the result change too?
- What if we send this email to the segment of inactive subscribers we want to reactivate?
After we run out of hypotheses, we make a slide with our conclusions on the whole series of tests.
In our case, the results may look as follows:
- To increase conversion, we should send emails with a dynamic product grid to the members of the loyalty program.
- Emails for other subscribers (those who aren’t part of the loyalty program) may contain either a dynamic product grid or the bestsellers: there’s no statistically significant difference.
- A static product grid without bestsellers converts worse than the one with the bestsellers in all the segments.
Now we understand what type of product grids we should use in different scenarios.
We usually check the results using an A/B test reliability calculator (you can find plenty of them online). It’s a key to making the right conclusions: some of the hypotheses showed better numbers but weren’t reliable.
Metrics we use to analyze email campaigns using the Tester’s Book
When we run A/B tests of email campaigns, we mainly rely on Open Rate, Click-through Rate, Click to Open Rate, and Conversion Rate:
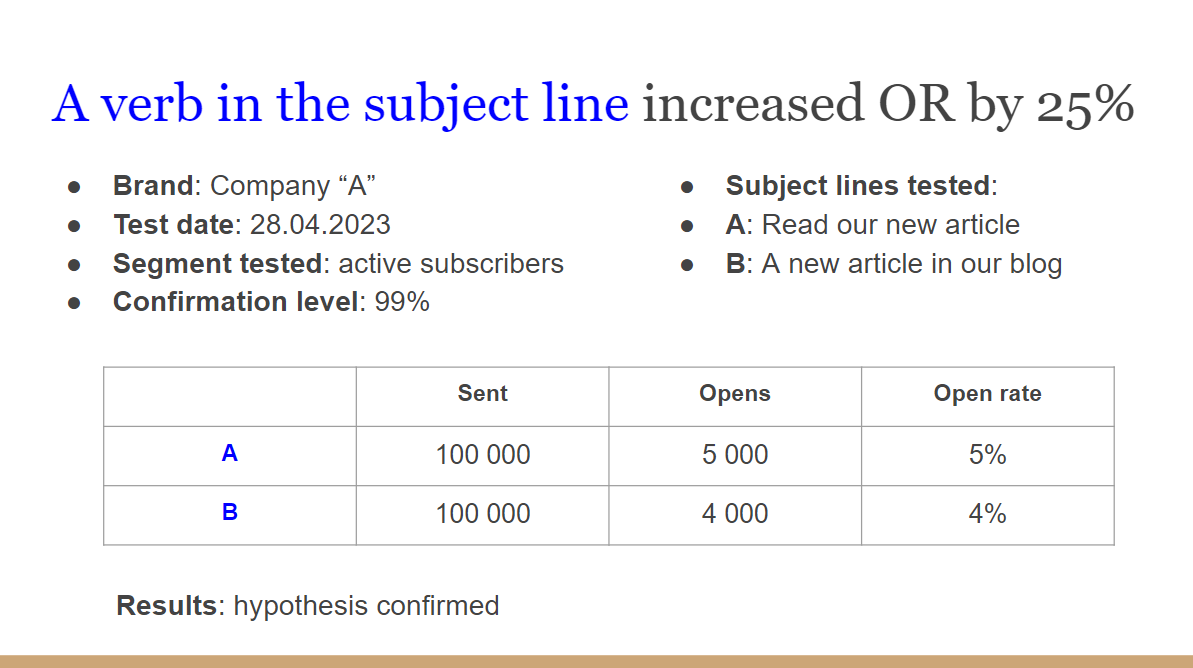
- OR helps us analyze the performance of various subject lines.
- CTOR shows whether subscribers like the content of our emails or not. We use it when we test various product grids, the location and color of buttons in an email, and so on.
- We rely on CR to assess the attractiveness of our offers for the customers. CR also serves as an additional evaluation of the winning option.
A hypothesis you may come up with after analyzing test results: “Okay, this option showed higher OR or CR, but did it result in more targeted actions?”.
Sometimes we see that the option with a lower conversion rate brings us more purchases (and money). In this case, we run an additional series of tests, enlarge the chosen segment, or test other segments. The results end up in the Tester’s Book as well.
7 A/B test ideas to improve your Open Rate
Every company has its methods to improve OR: they depend on your target audience, industry, and many other factors. We’ve created a list of hypotheses that may help you get to know your subscribers and what they like:
- A verb in a subject line or preheader: “Join our webinar now” vs. “Our webinar is on”.
- Emojis in a subject line or preheader: “❤️ Grab your promo code” vs. “Grab your promo code”.
- Using the first name for personalization: “John, your discount is inside” vs. “Your discount is inside”.
- Adding power words: “Your gift is waiting” vs. “Your 25% discount is waiting”.
- Placing the details of the offer in a subject line or preheader: “10% discount. Cyber Monday sale” vs. “Cyber Monday sale is on”.
- Sending emails on weekdays earlier or later than usual.
- Sending emails on holidays earlier or later than usual.
Some of the results may surprise you. For example, you may find out that emojis don’t influence your OR at all ☹️ or that your target audience engages with the emails sent in the evening much better.
6 A/B test ideas to improve your Click-through Rate and Click to Open Rate
Just as with the open rates, you will develop a unique set of methods that will increase the CTR and CTOR of your email campaigns. Here’s a list of universal hypotheses you may want to try:
- adding a CTA to the main banner;
- using a countdown timer to show urgency;
- adding social proof elements (e.g. testimonials or customer reviews);
- using GIFs instead of static main banners;
- using photos of real people (e.g. CEO or other employers) as the main banner to add a human touch to your email;
- include interactive elements (like polls, quizzes, or “Did you like this email?” sections).
Keep this in mind when you work with a Tester’s Book
If you choose a Tester’s Book as your go-to tool for analyzing A/B testing campaigns, don’t forget to:
- check whether the results are credible using a reliability calculator;
- write down all the information on a hypothesis (even if it is proven wrong);
- repeat the test with a different segment or a larger number of recipients if you get unreliable results.
The more information you gather, the easier it becomes to understand what works best for your (or your client’s) business and your target audience.
Why we believe a Tester’s Book is a game-changer
A Tester’s Book became a must-have for our company because now we:
- Know what works best on a case-by-case basis and use it in new campaigns. For example, we want to make the most out of a new promotion. We look through the Tester’s Book, search for the most effective methods that can be applied to this campaign, and use them. The result: more opens, clicks, and purchases.
- Can predict the outcome and decide whether some techniques are worth it. For example, we learn from the client’s Tester’s Book that personalized “Recommended items” elements bring more purchases but are more difficult (and expensive) to develop . We make a sales forecast based on the test results: calculate profits and implementation costs and make a decision.
- Can justify our decisions to the clients. For example, a client wants to include emojis in their email subject line, but the test results show that this usually decreases the open rates of their email campaigns. The Tester’s Book will help us prove our point and let the client make the right decision (because no one wants to hurt their own business on purpose).
Testing and analyzing the results not only help to improve current performance, but also allow you to understand the customer better, develop an effective communication plan, and create new products.
And a convenient tool for storing test results will let you find the perfect approach for every situation and turn it into a successful email campaign much faster. That’s what a Tester’s Book has become for us.
 Photo by Matt Artz on Unsplash
About the author
 Ivan Ilin,
CEO of Blocks and EmailSoldiers Inc.
With 10 years of experience in email & marketing automation, Ivan Ilin has learnt all the nuances of digital marketing (both from client and agency’s perspective). Ivan co-founded a team of marketing enthusiasts that now has over 100 people.
Always open to new connections on LinkedIn.